Statistics Dashboard
The Statistics page provides analytics and insights through customizable, drag-and-drop widgets.
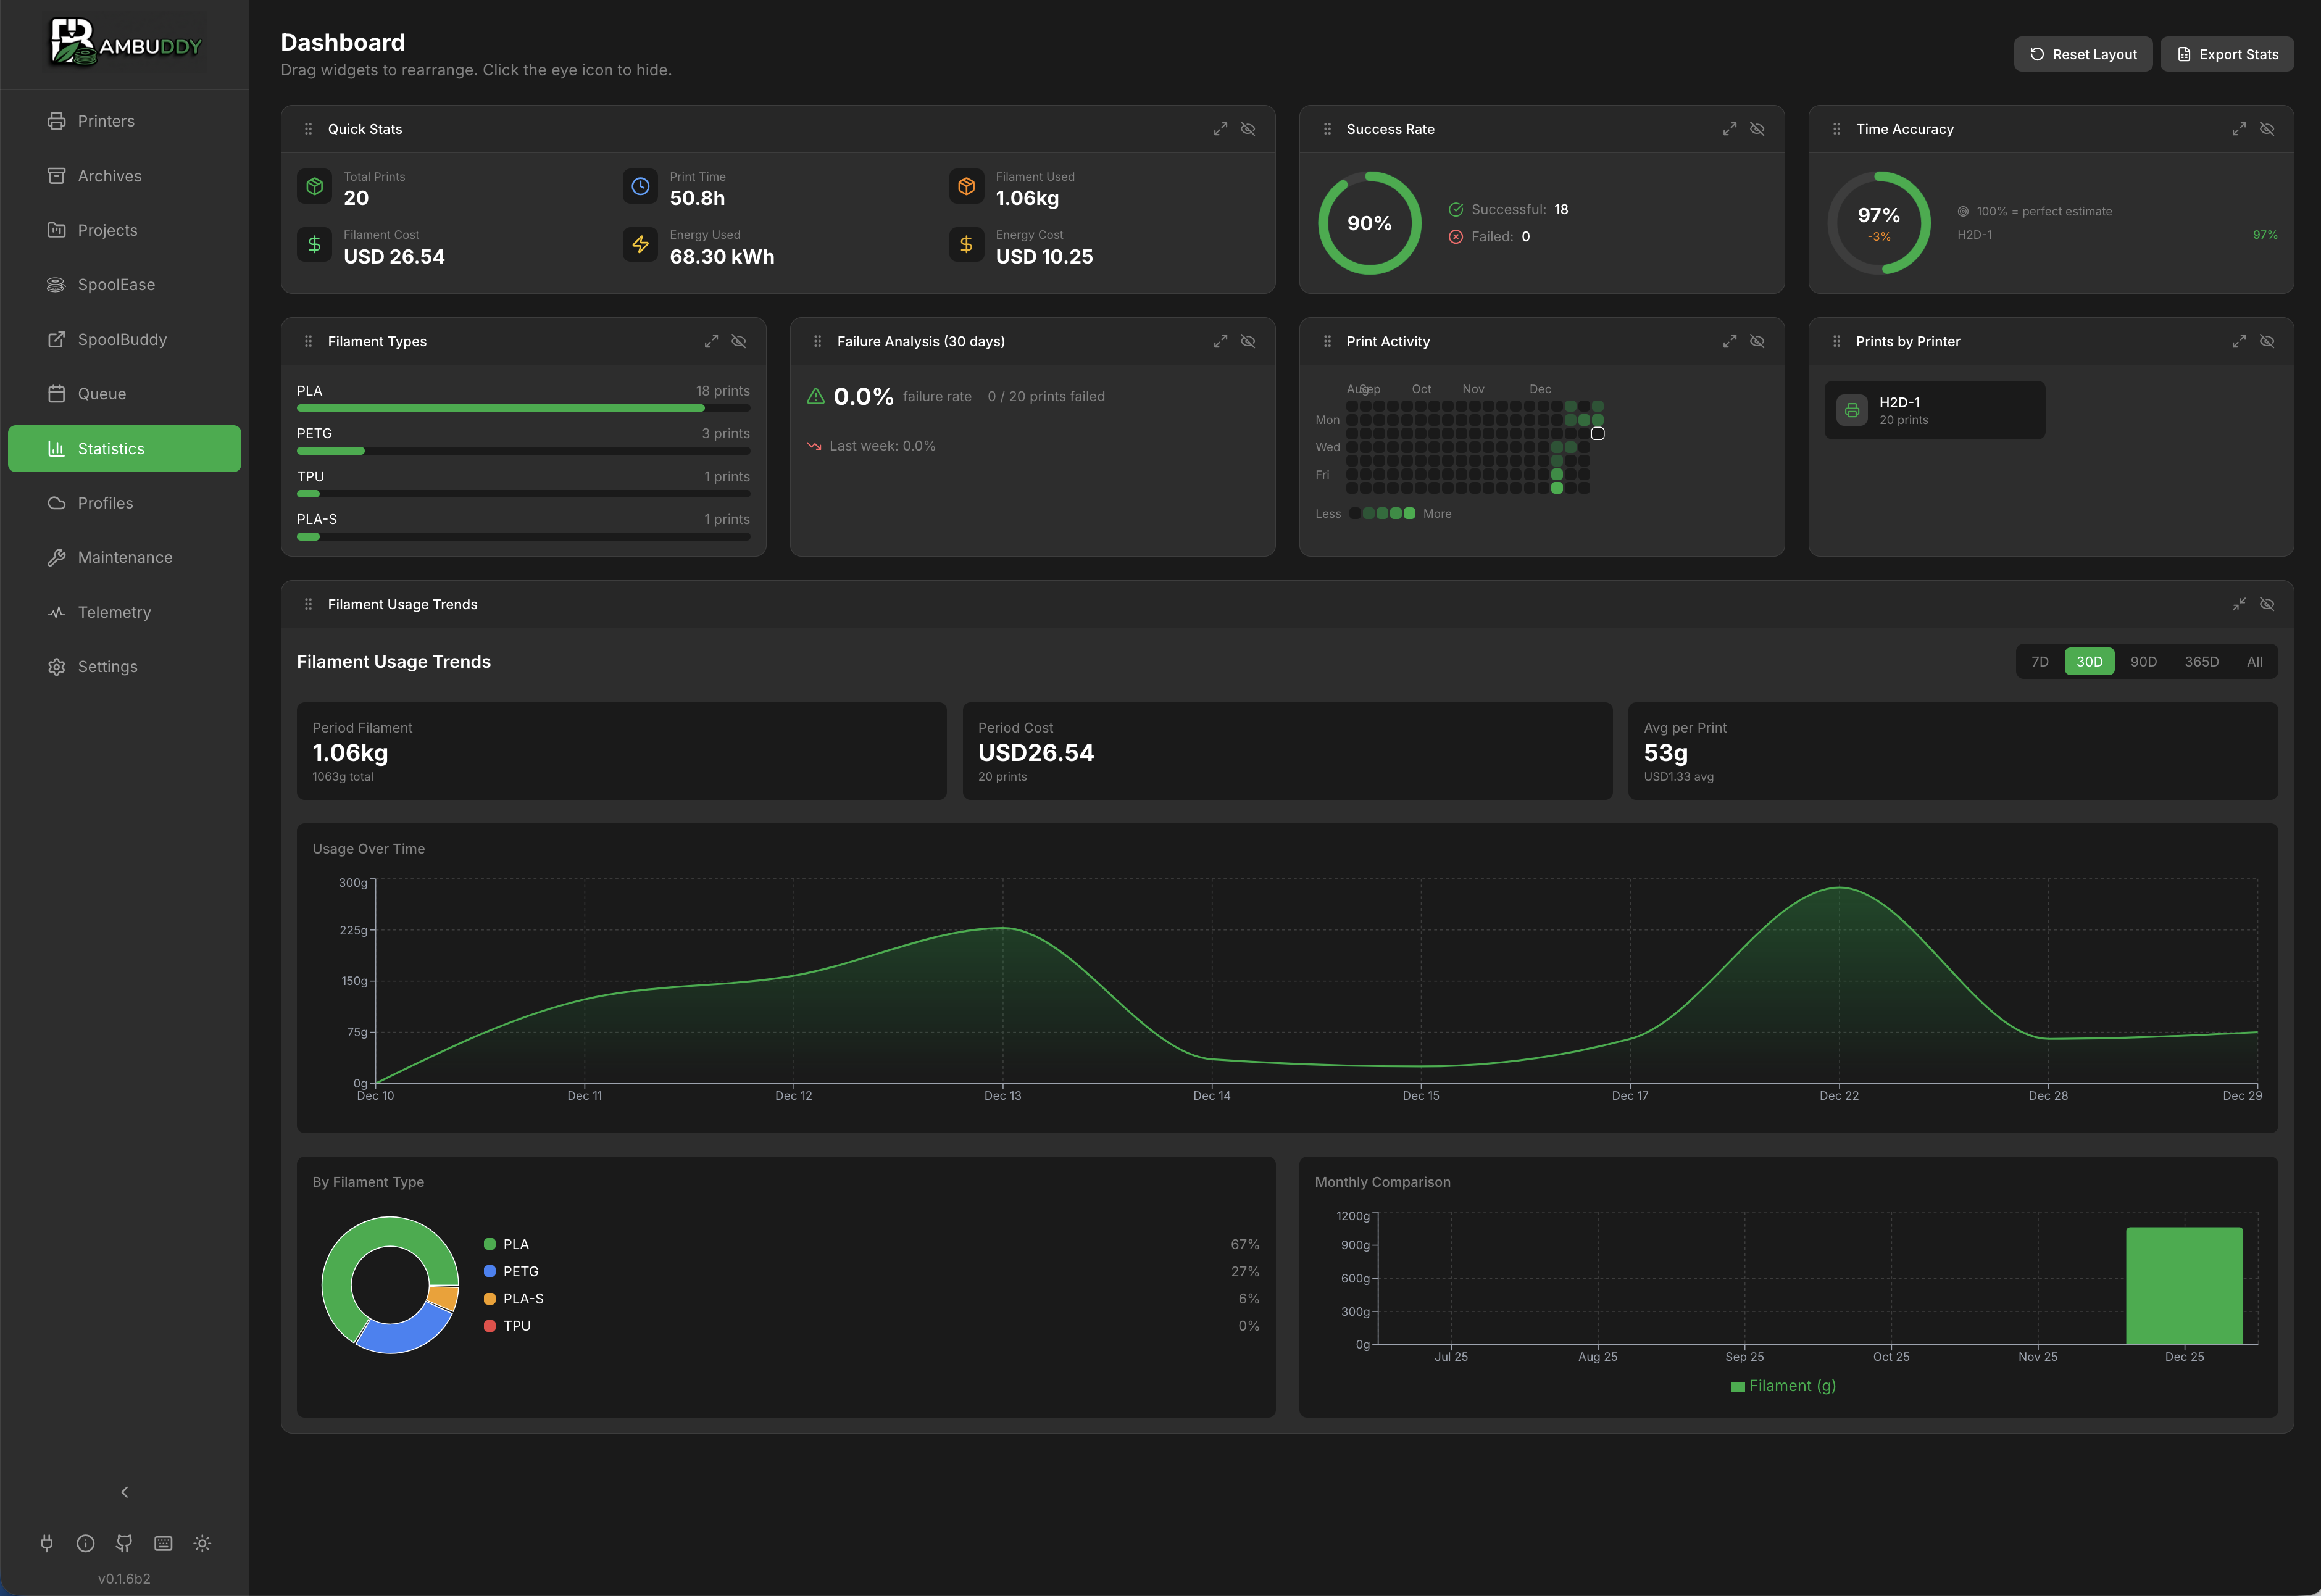
Dashboard Overview
The dashboard displays multiple widgets that you can:
- Drag to reorder
- Resize to emphasize important data
- Hide widgets you don't need
- Reset to default layout
Available Widgets
Print Success Rate
Track reliability across all printers:
| Status | Description |
|---|---|
| Success | Completed prints |
| Failed | Prints that failed |
| Stopped | Manually cancelled |
- Visual pie chart breakdown
- Per-printer filtering
- Success rate percentage
Filament Usage
Monitor material consumption:
- By type - PLA, PETG, ABS, etc.
- By color - Color breakdown
- Over time - Trend charts
- Total weight - Cumulative kg/g
Print Activity Calendar
GitHub-style contribution calendar:
- Daily print activity heatmap
- Color intensity = number of prints
- Click any day to see prints
- Identify printing patterns
Quick Stats
Summary statistics at a glance:
- Total prints in selected period
- Total filament used (grams)
- Total cost (filament + energy)
- Total print time
- Energy used / cost — honours the tracking mode set in Settings → General → Energy (Per-Print or Total Consumption) and respects the selected date range.
Configuration Required
Requires filament costs in Settings to calculate cost data.
Statistics aggregate per print event, not per archived file
Quick Stats and Statistics queries sum over individual print events (the same data backing the Per-archive Print Log), not over archive rows. So every reprint contributes its own filament / time / cost / count to the totals — even if you've printed the same archived 3MF ten times. A failed reprint at 10 g of a previously-successful 100 g print is recorded as two distinct events; Quick Stats correctly add up to 110 g across both, instead of the failed run overwriting the source archive's data.
Deleting an archive keeps its Quick Stats contribution
By default, deleting an entry on the Archives page does not rewind its filament, time, cost, or energy contribution from Quick Stats — the file is removed from disk and the row disappears from listings, but the totals stay honest. To also drop the print from statistics, tick the Also remove this print from Quick Stats checkbox in the delete confirmation dialog. See Delete Behavior on the Archiving page for details. The opt-in hard-delete removes the archive's linked Print Log entries as well so its run-by-run contributions disappear from the totals together.
Energy warming-up indicator
In Total Consumption mode, date-range energy values are computed from hourly snapshots of each smart plug's lifetime counter. On a fresh install or shortly after an upgrade, the first snapshot before your selected range may not exist yet — the Energy Used / Energy Cost tiles show a small yellow warning icon with a tooltip explaining the situation. After ~1 hour of runtime the indicator disappears for any range that starts after the first snapshot. See Energy Tracking for details.
Time Accuracy
Analyze estimated vs actual print times:
- Average accuracy - How close estimates are
- Per-printer - Compare printer accuracy
- Trend - Is accuracy improving?
Print Duration Distribution
Understand typical print lengths:
- Bar chart with duration buckets (<30m, 30m-1h, 1-2h, 2-4h, 4-8h, 8-12h, 12-24h, 24h+)
- Quickly see your most common print duration range
Filament by Type
Pie chart of material distribution:
- Click segments to filter
- Legend with exact amounts
- Percentage breakdown
Printer Utilization
Hours of active printing:
- Idle time percentage
- Per-printer breakdown
- Most/least used printers
Recent Activity
Latest completed prints:
- Quick status overview
- Click to view archive
- Last 10 prints
:material-gesture-tap-drag: Customizing Layout
Drag and Drop
Rearrange widgets:
- Hover over widget header
- Click the grip icon
- Drag to new position
- Release to drop
Resizing
Change widget sizes:
- Click the resize icon on widget
- Cycles through: Small → Medium → Large → Full Width
- Layout adjusts automatically
Hiding Widgets
Remove widgets from view:
- Click the eye icon on widget
- Widget is hidden
- Re-enable from controls
Controls Location
Dashboard controls are in the header row:
- Hidden - Show/manage hidden widgets
- Reset Layout - Return to default
Persistence
Your layout preferences are:
- Saved automatically
- Persist across sessions
- Stored per-user
Filtering Data
Time Range
| Range | Description |
|---|---|
| Last 7 days | Past week |
| Last 30 days | Past month |
| Last 90 days | Past quarter |
| All time | Everything |
| Custom | Pick start and end dates |
Per-User Filtering
Filter all statistics by a specific user — useful for universities, makerspaces, and multi-user environments where you need per-person accountability or cost tracking.
Requirements:
- Authentication must be enabled
- User must have the
stats:filter_by_userpermission (Administrators only by default)
How to use:
- Click the user dropdown in the stats header (next to the timeframe selector)
- Select a user to see only their prints, filament usage, and costs
- Select "All Users" to return to global statistics
- Select "No User (System)" to see prints without user attribution (e.g. slicer-initiated or pre-auth prints)
The filter applies to all widgets, failure analysis, and CSV/Excel exports.
Custom Permission Groups
To grant this permission to non-admin users, create a custom group in Settings → Users and add the stats:filter_by_user permission.
Printer Selection
View statistics for:
- All printers combined
- Individual printer only
- Compare across printers
Cost Configuration
To enable cost tracking:
- Go to Settings > Filaments
- Add your filaments:
- Material type
- Color
- Cost per kg
- Vendor (optional)
- Statistics calculate costs automatically
Cost Calculation
Recalculate Costs
If you change your default filament cost, existing archives retain their original calculated costs. To update all archives with current pricing:
- Click Recalculate Costs in the dashboard header
- All archive costs are recalculated using current filament prices
- Statistics update immediately
Reprint Costs
When you reprint an archive, the cost is added to the existing total. This ensures statistics accurately reflect total filament expenditure across all prints of the same file.
Export Data
Export statistics:
Export Options
| Format | Best For |
|---|---|
| CSV | Spreadsheets, analysis |
| Excel | Reports, formatting |
Export Contents
- Print history
- Duration, filament, cost
- Success/failure status
- Filtered by current view
Data Refresh
Statistics update automatically when:
- New prints complete
- Archives are edited
- Filters change
Manual refresh via the refresh button in header.
Tips
Weekly Review
Check the dashboard weekly to spot trends and issues early.
Per-Printer Analysis
Use printer filtering to identify reliability issues with specific machines.
Cost Awareness
Configure filament costs to understand your actual printing expenses.
Monthly Export
Export data monthly for record keeping and long-term analysis.
Time Accuracy
Watch time accuracy to calibrate your expectations for print times.
Calendar Patterns
The activity calendar reveals your printing habits - useful for planning.